Economic Revitalization
Tracking downtown revitalization
Since the onset of COVID-19, DSA has been tracking the impact on our local economy. As downtown bounces back, we continue to follow dozens of metrics to trace the path to full economic recovery. A few of these metrics are below.
Downtown Revitalization Dashboard
May 2024 (April data)
Downtown Seattle was the first American urban center to experience the impacts of COVID-19, enduring a sudden economic downturn. As downtown continues to evolve, DSA will publish a monthly Revitalization Dashboard examining key metrics. The data sets provide a comparison point to the same time period in 2019. Additionally, the dashboard will feature notable stories that provide context regarding downtown’s renewal and reemergence.
Please credit the Downtown Seattle Association Revitalization Dashboard for use of charts, data and images on this page.
Total monthly visitors since 2019
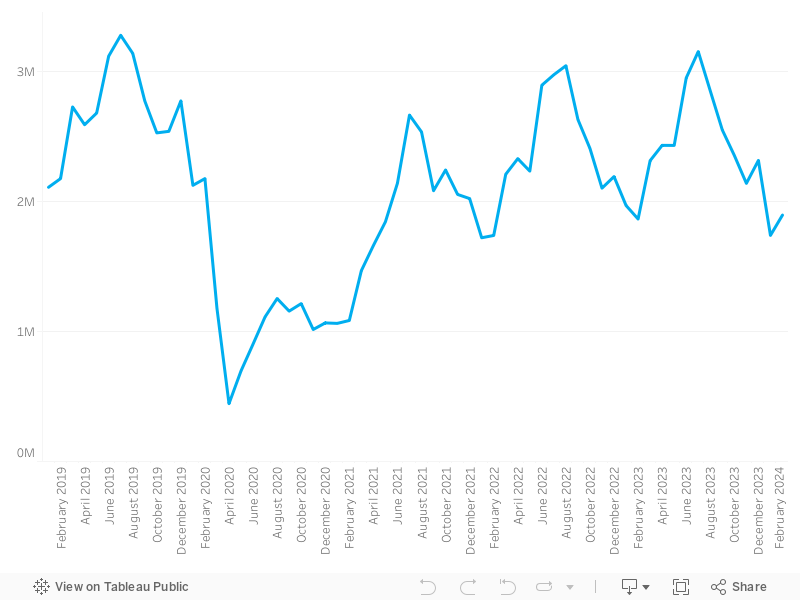
More than 2.2 million unique visitors came downtown in April 2024. The total number of April visitors was 87% of the number seen in that same month in 2019.
Average daily worker foot traffic (Monday–Friday)
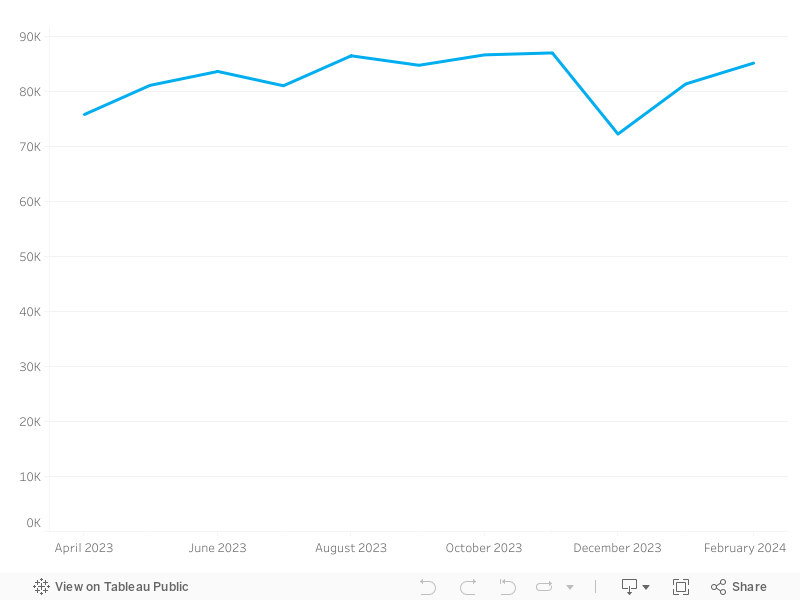
In April, downtown averaged more than 87,000 daily workers — the second-highest daily average for worker foot traffic since February 2020. This figure represents a 17% increase from April 2023 and is 53% of the daily foot traffic seen in April 2019.
Monthly hotel rooms sold compared to 2019
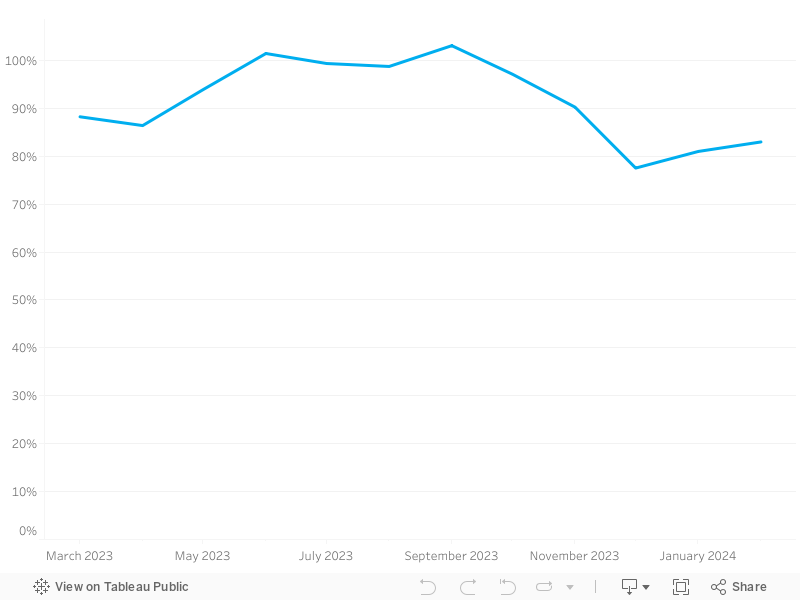
The number of downtown hotel rooms sold increased by nearly 10% in April 2024 compared to the previous year. This represented 94% of demand in April 2019.
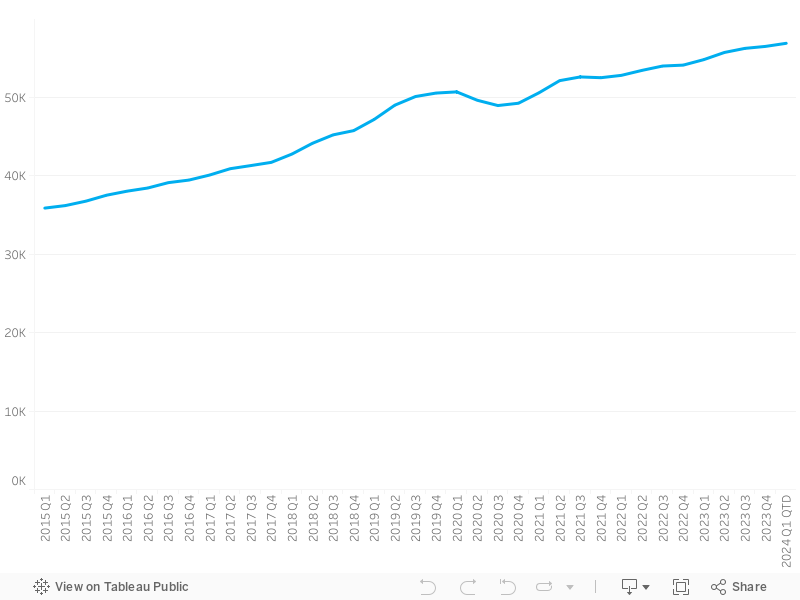
In April, the number of occupied apartment units remained at more than 57,000. This represented a 2.6% increase in occupied units compared to Q2 2023 and a 17% increase compared to Q2 2019.
Of Note in Downtown
![]()
The DSA/MID Clean Team collected 431,835 gallons of trash from sidewalks, curb lines and alleys the first four months of 2024.
![]()
Through Q1 2024, incidents of violent crime and property crime downtown have fallen by nearly 15% compared to Q1 2023.
![]()
Coming Up in Downtown

Arguably the best player in the history of women’s college basketball is coming to Climate Pledge Arena. Caitlin Clark and the Indiana Fever take on the Seattle Storm on May 22. The celebrated rookie has produced sold-out arenas at preseason games. The atmosphere should be electric.

The 53rd Northwest Folklife Festival takes over Seattle Center and the Uptown neighborhood May 24–27. The four-day festival attracts an estimated 250,000 attendees and more than 6,000 performers.

Seattle Waterfront Marketplace is scheduled to make its debut at the end of the month. The indoor daily market will be for local artists, artisans and craftspeople to sell their handmade products. Located on Alaskan Way across from the Great Wheel, the marketplace will be free and open seven days a week.
COVID-19 Downtown Recovery Weekly Snapshot
These charts show weekly statistics from March 2020 through the most recent week available. To indicate the level of recovery, data is displayed as a percent of the same metric for the comparable week of 2019.
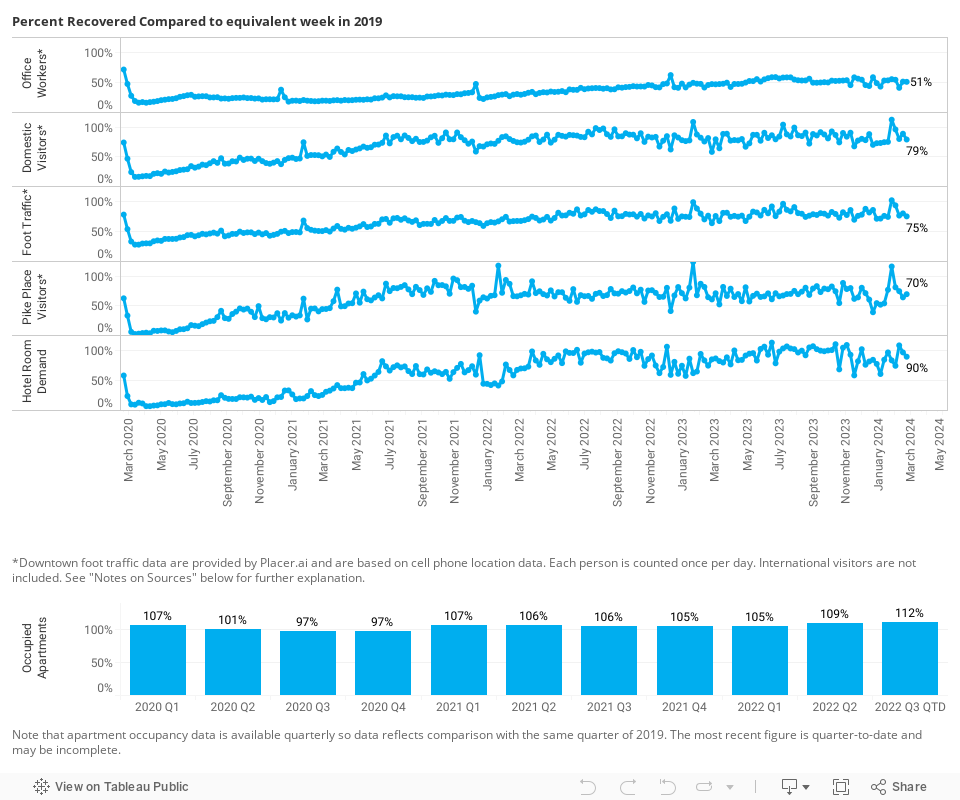
Notes on Sources
Downtown foot traffic data are provided by Placer.ai and are based on cell phone location data. Each person is counted once per day. International visitors are not included. Subsets of this data in the charts are as follows:
- Office worker presence is estimated based on visits by workers who were present between 8 a.m. and 6 p.m. on weekdays in the downtown neighborhoods with the heaviest concentration of office space.*
- Total visitors includes those who do not live or work downtown. It does not include international visitors.
- Hotel data are based on monthly reports from STR, provided by Visit Seattle.
- Apartment occupancy data are from CoStar. This is reported quarterly but the current quarter data are updated in real-time as new information is added to the database.
- Domestic visitors counts those who do not live or work downtown.
- Total foot traffic includes all visits to downtown by domestic visitors, residents and workers.
- Pike Place Market visitors includes domestic visitors who do not live or work at the Pike Place Market.
*Note that workers who have not visited their work site in the past 90 days are classified as “visitors” until they are regularly visiting their work site at least three times in a one-week period.